

Digital Transformation | User Experience | User Interface | modernization | business dashboard
In today's data-driven business landscape, having access to accurate and actionable information is crucial for strategic planning and decision-making. With the right, modern systems in place, you can visualize complex data sets, track key metrics, and gain real-time insights into your company's performance. Whether you're tracking sales figures, website traffic, or customer satisfaction scores, a well-designed interface lets you monitor these metrics at a glance.
But you can’t just reach into a box and pull out the perfect, cookie-cutter dashboard to instantly improve understanding around your data visualization. You need to choose the right approach for your business's unique needs. That's why we've compiled a selection of data visualization, business intelligence (BI) tools, and business dashboard examples that showcase different layouts, designs, and functionalities. From simple, minimalist ways to visualize data to complex, data-intensive ones, these examples will inspire you to envision a solution that aligns perfectly with your company’s strategic goals.
Different Approaches to Tell a Story with Data
Charts are a great way to take complex data and restructure it into a digestible format. But does a handful of charts make a dashboard? Let’s break down and contextualize some of the visualization methods and elements used across industries.
Data Visualization
Data visualization refers to the representation of data in graphical or visual forms, such as charts, graphs, and maps. The goal of data visualization is to present complex data sets in a visual and intuitive manner, making it easier to understand patterns, relationships, and insights.
Business Dashboards
A dashboard is a visual display of key information, metrics, and data points that provide a consolidated view of various aspects of a business or system. Dashboards are designed to present data in a way that is easy to understand and can help users monitor performance, identify trends, and make informed decisions. Business dashboards are a collection of data visualizations that tell a more complex story through varied lenses of interest.
Business Intelligence (BI) Tools
BI tools are software applications that enable organizations to collect, analyze, and visualize their data to gain insights and make data-driven decisions. They go beyond the capabilities of a standard business dashboard or standalone visualizations, providing robust analytics features, data integration, and often, predictive modeling capabilities. They are a comprehensive tool for managing and analyzing data to support business decision-making.
While dashboards are a specific type of data visualization that presents a consolidated view of key metrics, business intelligence tools encompass a broader range of functionalities for data management, analysis, and visualization.
Data Visualization Examples
GE Transportation | Logistics
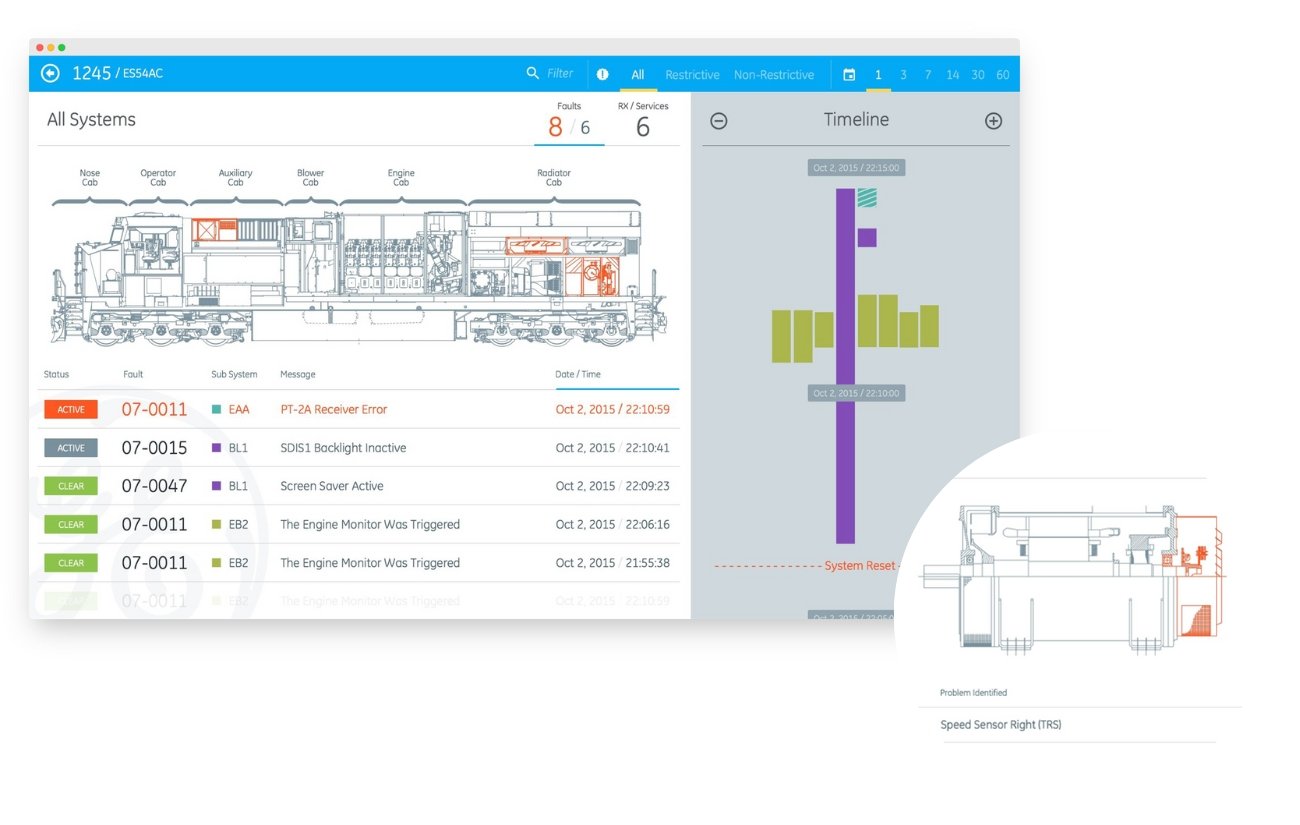
GE Transportation was looking for a prototype for locomotive diagnostics deployed on a mobile platform to buy down risk and serve as validation prior to proceeding to the next stage of development. To meet their goals, Aviture crafted the roadmap for a fully operational proof of concept application designed to save their users’ (machinists, electricians, laborers, and parts runners) valuable time.
Carson Group | Fintech
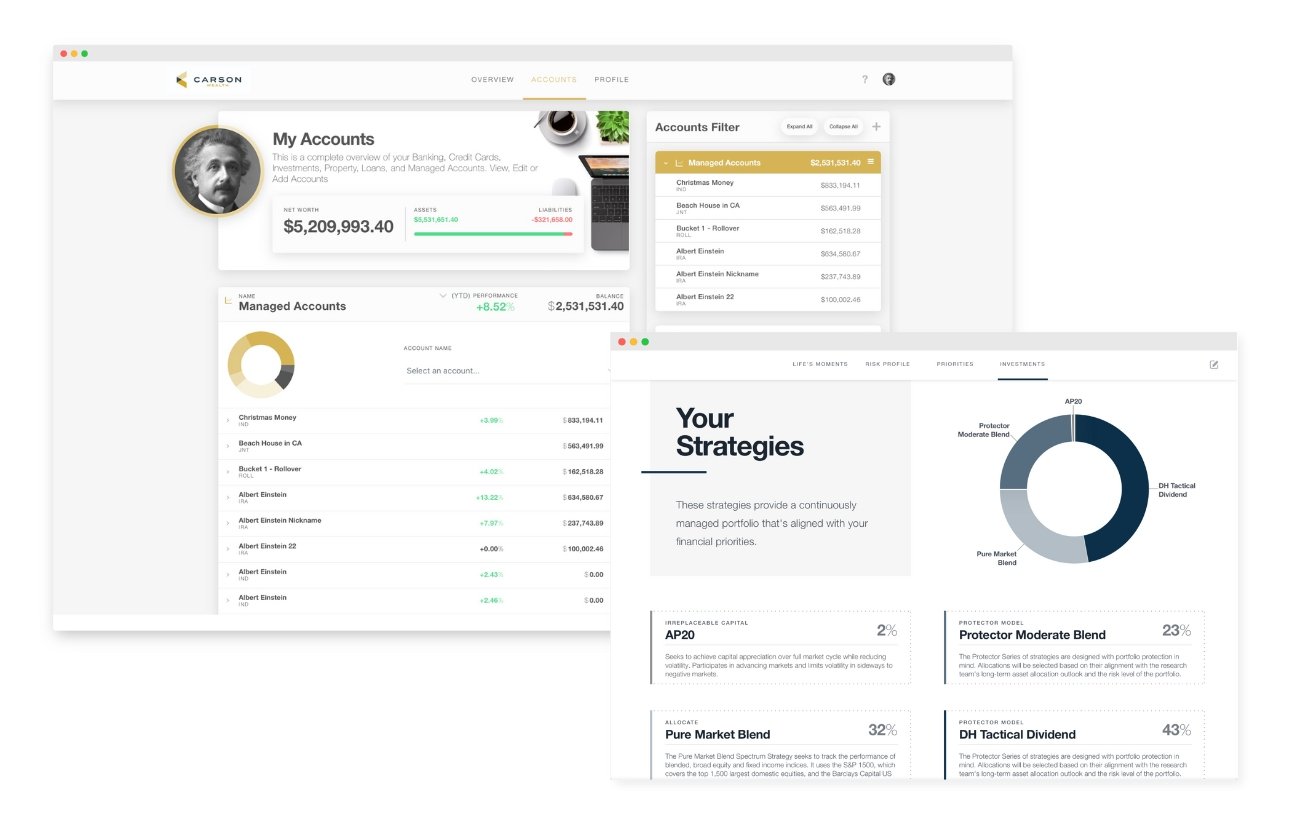
Carson Group, a financial services firm in Omaha, NE, recognized the need for a new customer dashboard to attract a younger generation, so they contacted Aviture for support. After a discovery phase and initial review, Aviture revealed a significant amount of useful data within Carson’s systems that, once unlocked, would be immensely beneficial to customers and advisors alike — but most importantly, unlocking the data would enable Carson to scale.
We fast-tracked the development of a client-facing application supported by an effective data warehouse. The application was met with considerable praise and exceeded Carson’s previous adoption rate of 10-13%, climbing to a staggering 50-75% in the first two weeks of deployment.
“Aviture has really delivered for us. I’m happy with the progress we’ve made in developing our experience for the client and the advisor. We won a $68MM account because of Aviture.”
— Ron Carson, Carson Group Founder and CEO
Business Dashboard Examples
Ensocare | Healthcare
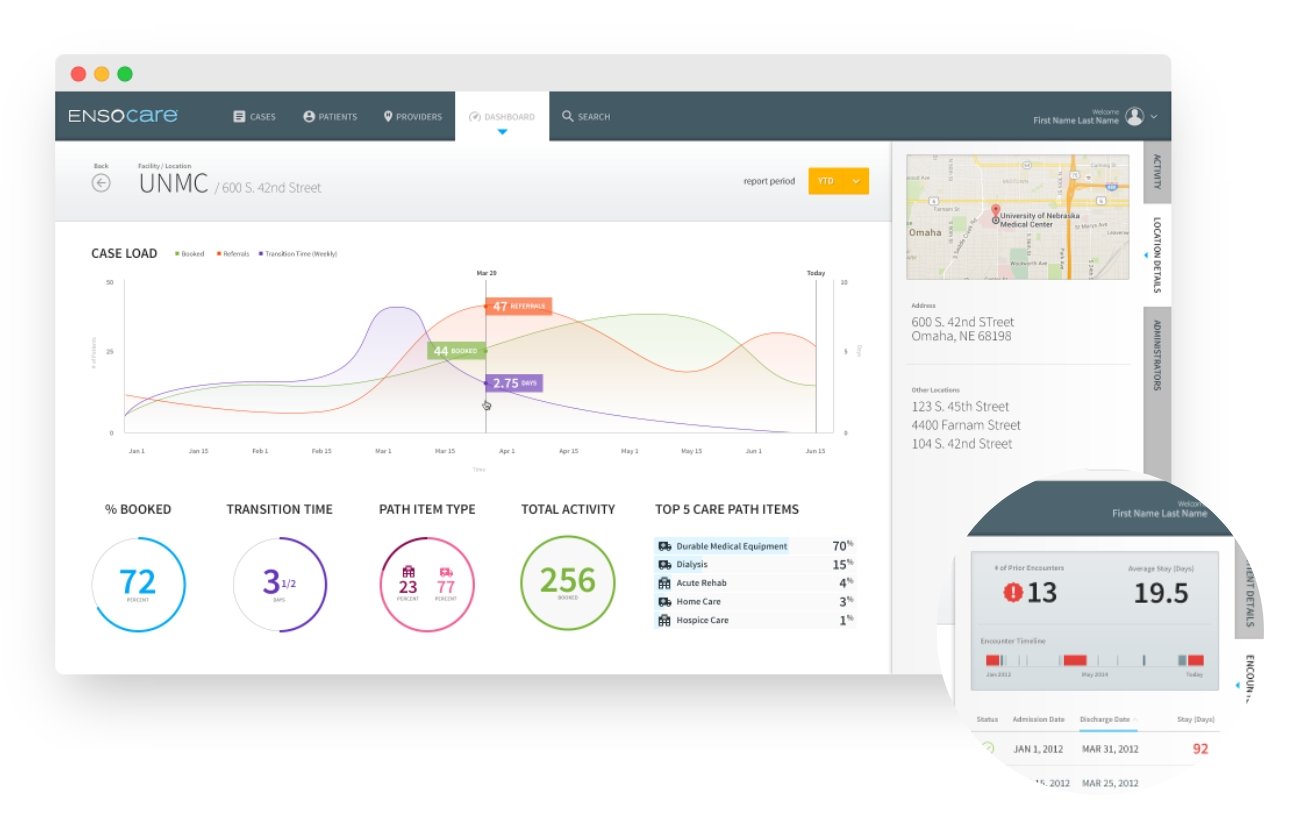
Ensocare sought help in effectively handling and minimizing the rate at which patients need to be readmitted to hospitals. Their primary goal was to alleviate the financial strain on hospitals and ensure that patients receive comprehensive rehabilitation at the appropriate facility, avoiding any relapse in their conditions.
Aviture developed a web-based system that seamlessly integrated with patient health systems and retrieved medical health records — all while adhering to HIPAA regulations. The platform additionally presents metrics and analyses to evaluate the effectiveness of various facilities and the correlation between patients and their historical performance within those facilities.
In the end, the new business dashboard helped Ensocare adhere to government requirements, improve the client experience, and unlock new and intelligent ways to analyze and share data.
Decision Logic | Retail and Hospitality
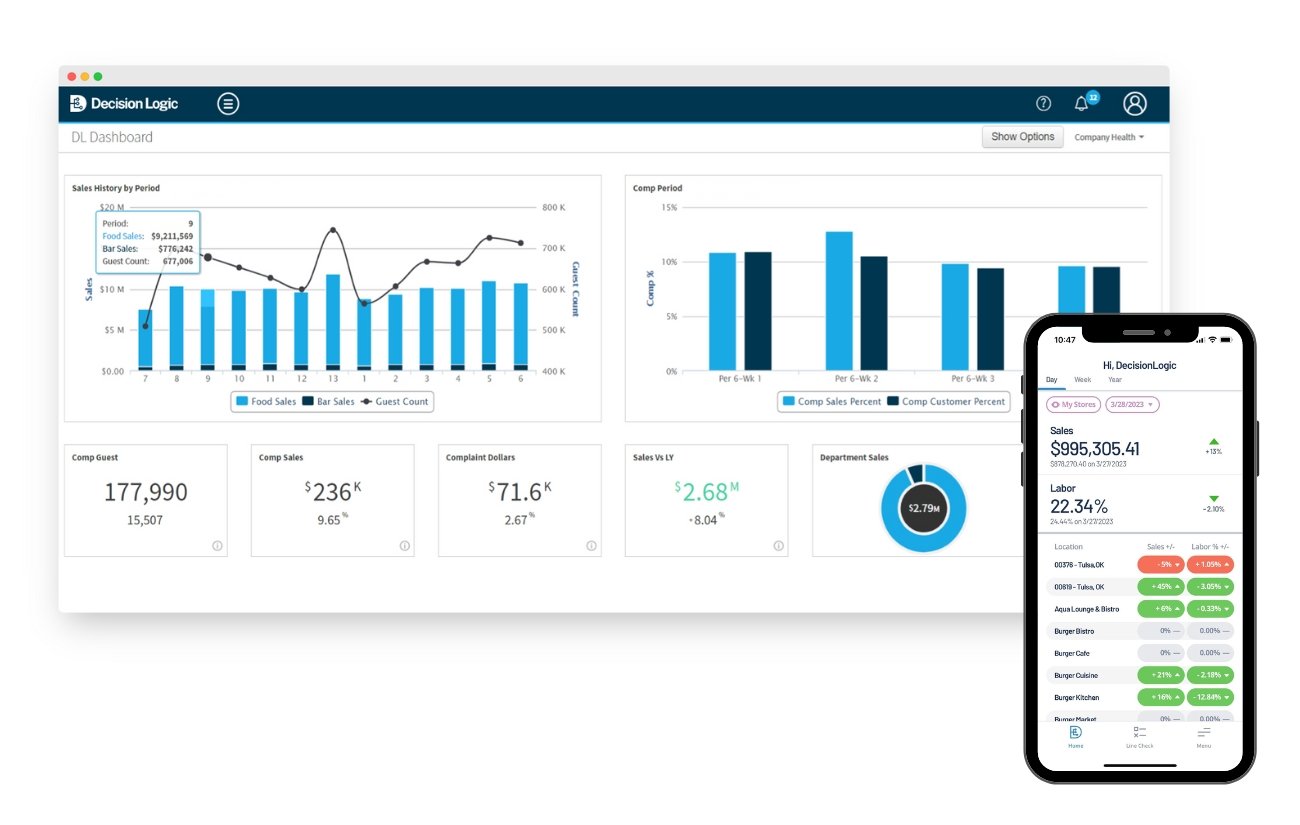
Decision Logic had long sought to provide a data-backed, systems-integrated solution to bridge the restaurant technology gap. When it came time to scale the company, Decision Logic turned to Aviture for help to provide additional app functionality and support for a new version of their software that would allow them to achieve unprecedented success.
Today, Decision Logic offers instant access to data, labor scheduling, line checking, inventory management, the Logic Shield PCI security system, and more. These tools create an all-in-one solution so restaurant operators can focus on providing the best experience to their customers.
“If we would not have had Aviture and their influx of technology to catapult us into the 21st century, our product would have died, no doubt, within the last five years.”
— Mandi Wooledge, COO of Decision Logic
Moody’s Analytics | Fintech
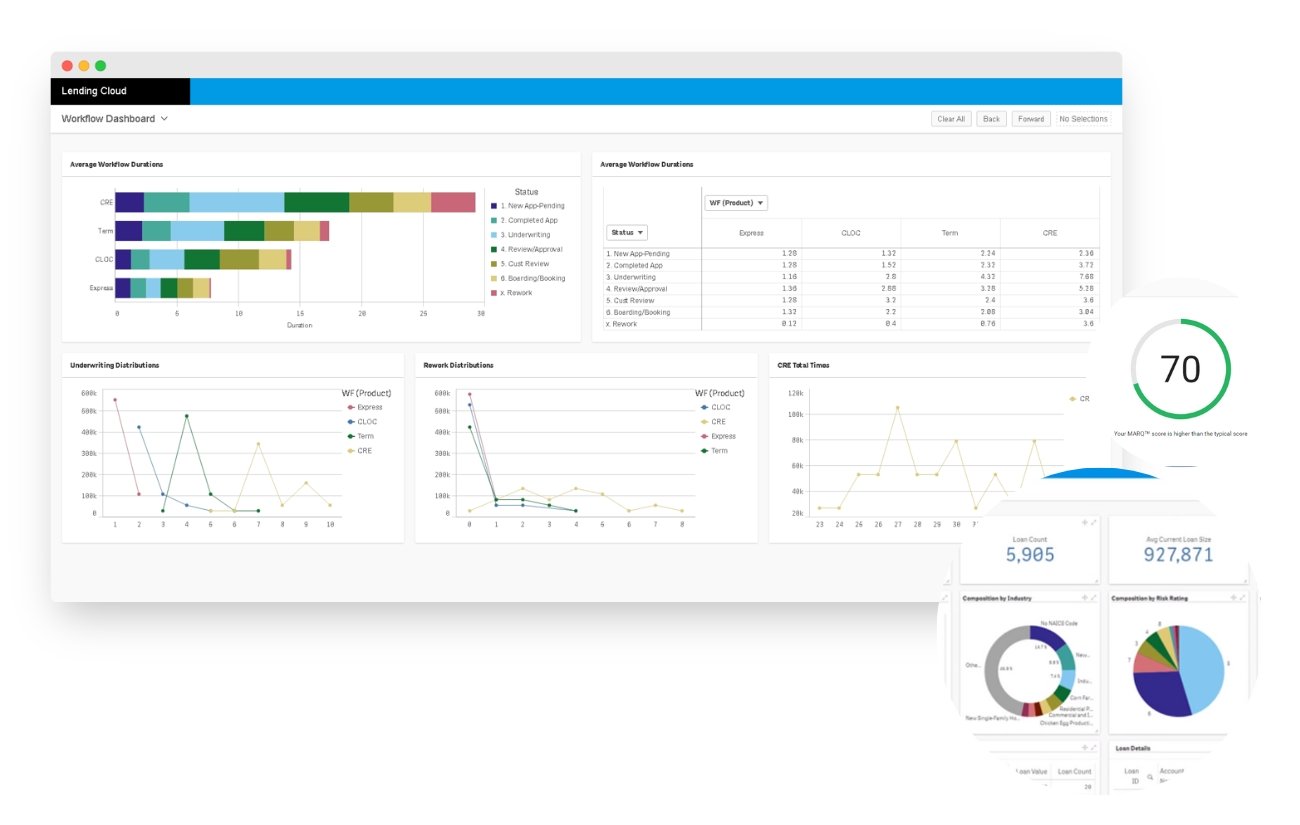
Moody’s Analytics came to Aviture with two needs: help create their premier RiskCalc™ Small Business solution, a risk assessment tool designed for lenders and credit analysts to better understand their small business clients; and devise a brand-new dashboard interface for Lending Cloud, a web-based risk analysis system created for banking institutions.
Aviture’s integrated tech teams were up for the challenge for both desired solutions. Together with Moody’s Analytics, we built the API and integration infrastructure for RiskCalc’s multiple data streams, allowing users to improve the credit risk assessment of their small business portfolio by combining different types of data to produce an optimized score.
For Lending Cloud, we built a cloud-based, self-service dashboard from the bottom-up, providing over 800 U.S. banks and credit unions with a fully integrated credit management solution flexible enough to handle commercial, agricultural, and small business lending.
BI Tool Examples
Guardian | Government
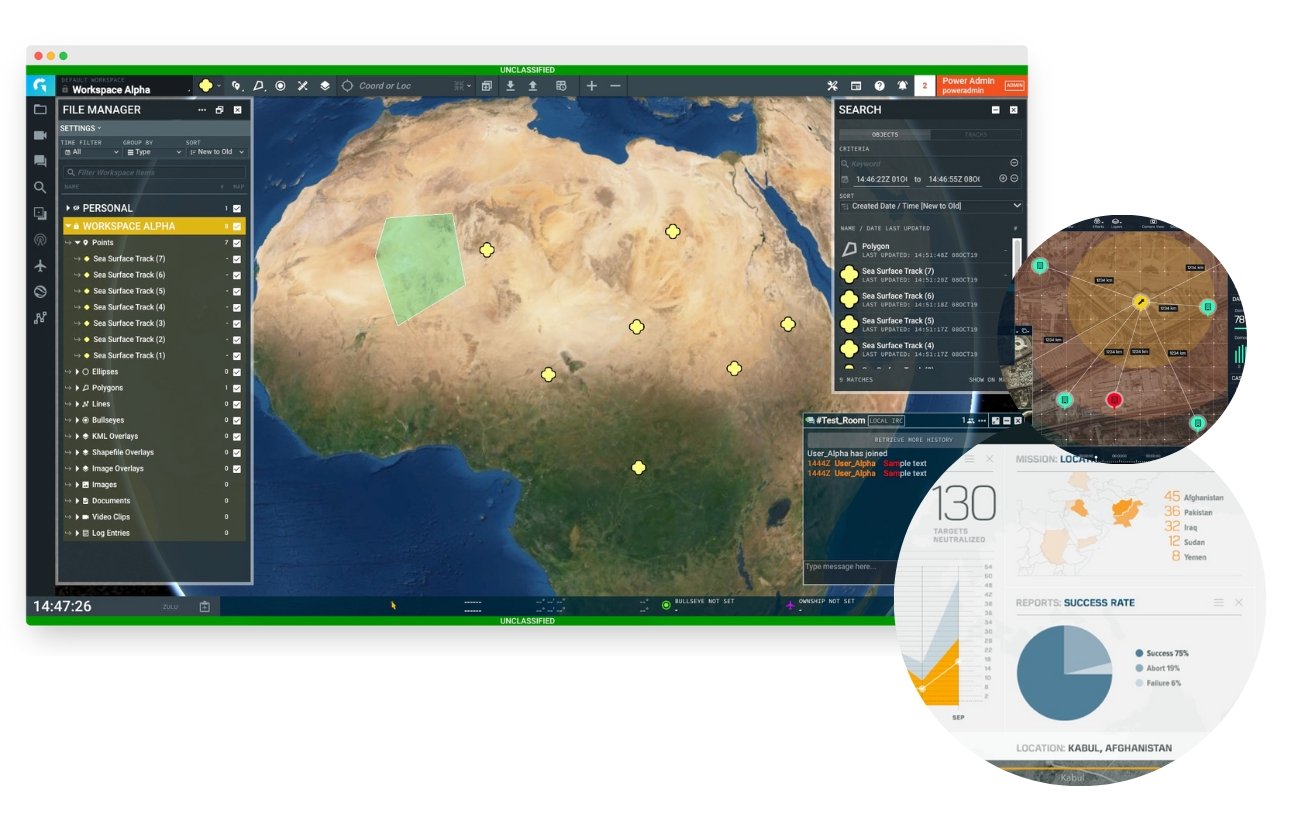
With a need for real-time situational awareness to ensure the safety of service members, the Department of Defense came to Aviture with the need to consolidate multiple data platforms and provide real-time decision support for their mission management.
Blending intelligence and operational intel into a common environment, Aviture developed a real-time collaboration platform that utilizes an intuitive and responsive interface that enables personnel to communicate and execute critical missions quickly and efficiently.
Guardian has proven to be an invaluable, life-saving device supporting California firefighting, hurricane relief efforts, NATO, and more, at both the federal and state levels.
“The great thing about Guardian is you don’t have to be in the same room or even the same building with users to see the same thing they see. And that’s been the biggest limitation we’ve seen from other platforms out there.”
— Major “Streak” Travis, 147th Attack Wing, Chief of Standards and Evaluations
HealthFitness | Healthcare
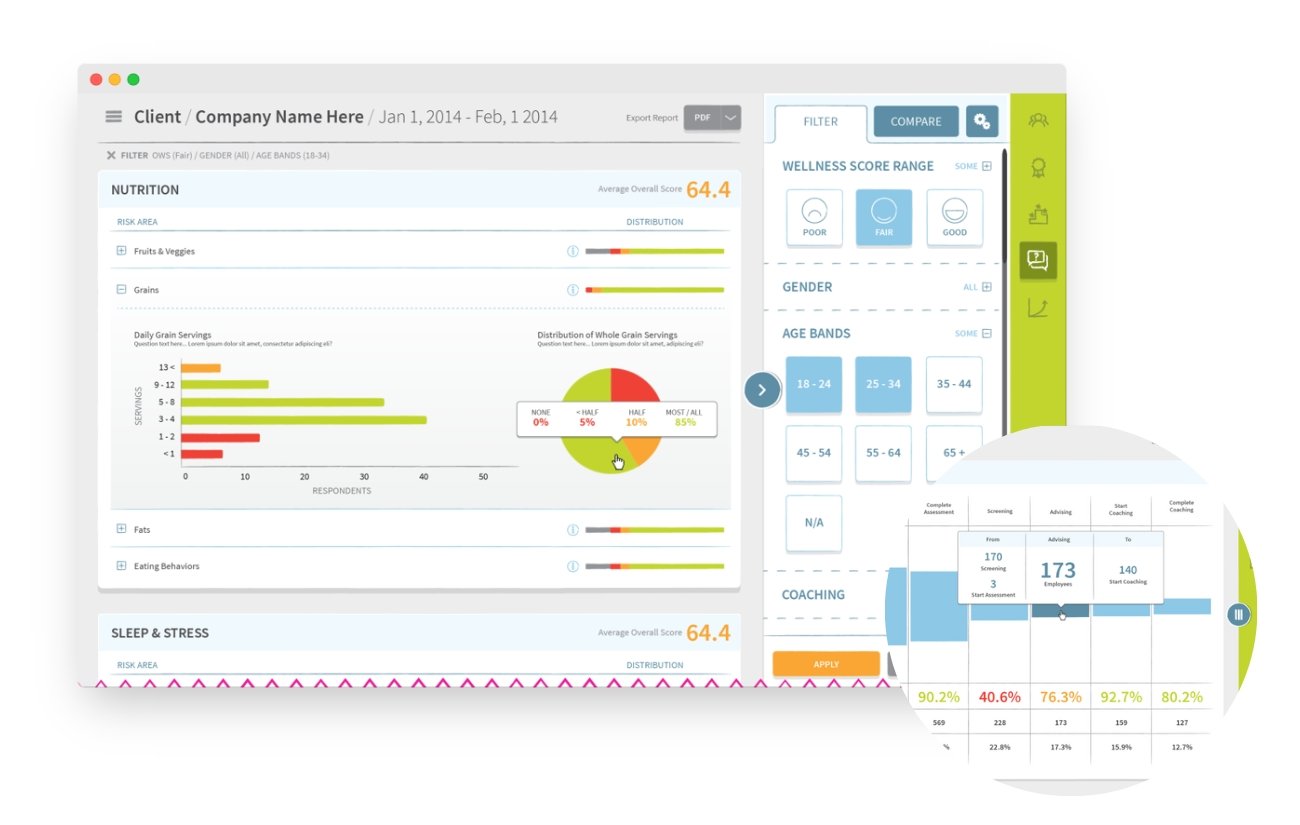
Trustmark’s HealthFitness needed an integrated wellness management platform to engage employees in their well-being. We devised a comprehensive solution that put user experience front and center.
Aviture led the creation of a product roadmap to make it easier than ever for employees to track and improve dietary and fitness habits over time, allowed employers to analyze trends across their workforce, and provided actionable insights to boost wellness and reduce health-related labor costs, all from a centralized, user-friendly tool. Aviture helped paint a vision of a future where HealthFitness could have a much greater impact for their customers, all through a powerful business intelligence tool.
Choosing the Right Way to Display
Data-driven decision-making is an ever-changing landscape, so how do you know what approach to take? Whether you’re already working with a dashboard that needs some significant updates, or you need a solution built from scratch, there isn’t a one-size-fits-all choice to be made. Taking the time to understand your needs and the problems you’re trying to solve is the most effective path toward the most business impact, but that’s easier said than done – right?
That’s where Aviture comes in. Our integrated teams work with your organization to help understand and identify the business value around solutions, connecting ROI to innovation. We help organizations overcome problems, communicate a vision, and provide meaningful impact through collaborative and iterative engagements. Contact us today and let’s get started on making your data visualization a reality.
